on
Elevate your Prometheus alerts with the help of unit tests

Table of contents
- Introduction
- What is an alert?
- How can you test it?
- What about unit testing?
- Key takeaways and unsolved problems
- Additional resources
Introduction
Monitoring services and reacting to outages promptly is crucial for online success.
If your company offers online services you can’t afford not being operationally excellent: your service being down for minutes (sometimes just seconds!) can create non-negligible damage to your customers and sometimes severely impact your reputation and trust. What excellent means might vary a lot, depending on the use case, the scale of your company, the maturity of your products, and your agreed SLAs, but the point is that if one of your systems experiences an outage, you’re expected to be the first to know about it, to inform your customers while the incident is still ongoing, solve the issues (as soon as possible) and last but not least share a detailed report including what happened and what measures you have put in place to prevent that from happening again in future.
Even if you are a company like Google, with the best software architectures and a pool of incredibly skilled engineers, it's important to recognize that failures can still occur. It's crucial to be well-prepared for such scenarios and not overlook the possibility of them happening.
The prerequisite to meet the above expectations is to leverage a monitoring and alerting system that gives you the power to decide what metrics are really relevant for your systems/services health and how to alert if bad symptoms show up. That said, even the most powerful monitoring tool is practically useless if you don’t ingest the relevant service metrics and don’t define top-quality alerts.
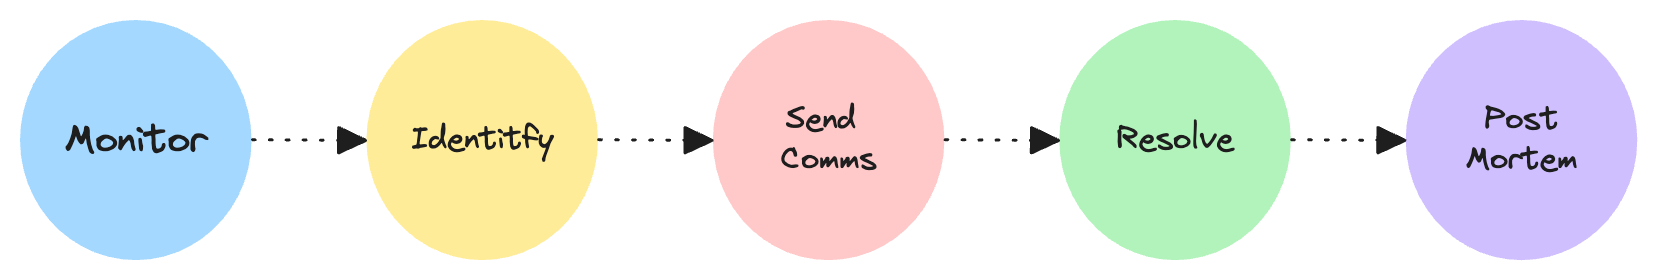
What I’ll talk about here mostly relates to the Monitor and Identity steps depicted in the above drawing, and it is specific to the Prometheus monitoring system, which I had the chance to work with during the last years, other than being one of the most adopted open-source solutions for monitoring purposes.
Testing that your alerting works end-to-end is fairly complicated, considering the many components usually involved in an alerting system, and as such a little too much for this article.
Here I’ll focus on how to write better alerts for your systems with the help of unit tests.
What is an alert?
An alert is a condition that when met should trigger some sort of action in your systems. You can define an alert in Prometheus with the help of an alerting rule:
rules:
  - alert: InternalServerErrors
    expr: http_requests_total{service="payments-api", status="500"} > 0
    labels:
      severity: critical
    annotations:
      summary: "There have been internal server errors in the last minutes!"
      runbook_url: "https://my-playbook.com/500-what-to-check"
The key components of an alert in Prometheus are:
- An expression written in PromQL language, defined on a metric, which describes the condition under which the alert should fire
- A severity indicator, representing how bad the specific alert is and what urgency of action requires
- Context information, useful for troubleshooting purposes and ease of readability. You can even define custom annotations to include your team’s runbooks!
- Optionally, a duration clause describing how long to wait before treating what’s defined in the expression as an actual alert (not present in the above example)
In the above example, we are asking Prometheus to send an alert whenever a 500 HTTP status code is returned by any of the endpoints exposed by our payments-api service.
Note that the above example is deliberately oversimplified: usually, we’re interested in error rates/increases, coming from multiple instances of our service. We’ll see later in this article a more realistic sample using the rate function and sum operator offered by Prometheus.
How can you test it?
Once we have defined our alert, how can we double-check our expectations before shipping that to production and having to wait for real issues? Is there a way to verify that our alert will fire when our condition is met, and only in that case? In other words, can we check if our alert will notify us when an issue is there and at the same time won’t piss people off by being too noisy during an off-hour on-call shift?
Of course, we can.
A naive approach could be to release your alert in your test environment and alter the responses of your services so that we can hit the alert condition (the payments-api in our previous example). Such a test helps you get confidence about your alerting system as a whole because you would have a chance to test not just the alert per se, but its routing which is a crucial thing for the quality of your on-call support.
The biggest drawback of this approach is that oftentimes is time-consuming:
- You might have to release a temporary code change on your services to return an altered response just to meet your alert criteria;
- Depending on the alert you might need to prepare some sort of load testing;
- if you’re in a team of a few engineers all working on the same services you have to pause releases in your development/test environment until you’re done with your tests;
- You could end up wasting a significant amount of time because one of the many components of your alerting stack works slightly differently from your live environment, or does not work at all in development.
Sometimes this approach is not applicable either, because your alerting system is fully working only in production (usually not a good idea).
Another approach could be to slightly tweak your alert expression to easily meet the alert condition while developing and testing, and change it back to the final value before releasing it to production. This is surely easier than the first option presented, but at the end of the day you’re not really testing your alert in its final version.
What about unit testing?
It turns out there is a smarter and funnier option when you want to simply test your alerting rule, and that is offered by Prometheus itself: you can unit test your alert with the help of the promtool CLI and an additional YAML file where you can define simulated events (time series) and your assertions.
A basic example
A basic alert test file looks like the following:
rule_files:
  - ./alerts.yaml # The YAML resource containing your alerting rule(s)

# An array of tests, where you can define multiple tests for one or more
# alerting rules
tests:
  # Each element is a specific test
  - interval: 1m # this one defines the interval each value of below time series
    input_series:
      # The simulated metrics that will trigger our alert. In this case we're simulating 500 errors
      - series: 'http_requests_total{service="payments-api", status="500"}'
        # This means that we'll start with 0 errors, 1 at the first minute, and then 0 again on the second
        # Note that the distance between values here is defined by the above interval
        values: 0 1 0
    alert_rule_test:
      # Here we define our expectations for the alert depending on the time our
      # rule is evaluated.
      - eval_time: 1m
        # What we expect to happen at the first minute. This lines up
        # with the first 1 in the values above
        alertname: InternalServerErrors # The name of the rule we're evaluating
        exp_alerts: # What/if alerts are expected
          # At the first minute we expect 1 alert to be triggered with below details
          - exp_labels:
              severity: critical
              service: payments-api
              status: 500
            exp_annotations:
              summary: "There have been internal server errors in the last minutes!"
              runbook_url: "https://my-playbook.com/500-what-to-check"

      - eval_time: 2m # What we expect to happen at the second minute
        # We do not expect alerts here, as the errors are reset to 0
        alertname: InternalServerErrors
With the help of a similar resource, you can define one or more assertions on one or multiple alerts. As you can see, you can verify that your alerts not only fire but also reset as expected! Moreover, you can test that the contextual information matches your team's needs during on-call shifts.
The above test sample and the related alert are oversimplified, as mentioned. Let’s see how unit tests can even help us more with increasingly complex (and more realistic!) alerting rules.
Errors increase for multiple service instances
In the previous example, we defined an alert on a simple counter, namely http_requests_total. The problem is that counters are ever-growing metrics, and they are usually reset when your application restarts. Counters per se are probably not really useful to check the current number of errors returned by your service, a much better choice is to use them in combination with Prometheus’s rate function, which helps you calculate the per-second average rate of increase of errors. Last but not least, you likely have multiple instances of your services running in parallels, therefore you’re probably interested in aggregating results and this is where the sum operator comes to help:
- alert: UnauthorizedRequestsSpike
    # Alert if there's a spike of 401 errors > 10%
    expr: >
      sum(rate(http_requests_total{service="payments-api", status="401"}[2m])) /
      sum(rate(http_requests_total{service="payments-api"}[2m]))
      > 0.1
    labels:
      severity: warning
    annotations:
      summary: "There has been a spike of unauthorized requests in the last 2 minutes!"
      description: >
        There has been a spike of unauthorized requests in the last 2 minutes!
        Current value is {{ $value | humanizePercentage }}.
      runbook_url: "https://your-oncall-docs.com/what-to-check-in-case-of-401-spikes"
With the above snippet, we’re telling Prometheus to send an alert whenever the 401 error increase (over the total of requests) in the last 2 minutes is higher than 10%.
Let’s test this!
rule_files:
  - ./alerts.yaml

tests:
  # 2 minutes of requests growth without errors, then a first spike of errors at minute 2,
  # and then another one starting at minute 4
  - interval: 1m
    input_series:
      - series: 'http_requests_total{service="payments-api", pod="payments-service-abcd", status="200"}'
        # 0 10 20 50 100 150
        values: 0+10x2 50+50x2
      - series: 'http_requests_total{service="payments-api", pod="payments-service-abcd", status="401"}'
        # 0 0 3 3 20 20
        values: 0x1 3x1 20x2
    alert_rule_test:
      - eval_time: 1m # Note that 1m represents the second data point in the time series (10 requests, 0 401)
        alertname: UnauthorizedRequestsSpike
        # At minute 1, there haven't bee 401 errors yet. So we do not expect alerts.
        exp_alerts:
      - eval_time: 2m
        alertname: UnauthorizedRequestsSpike
        # At minute 2, we have a total of 23 requests, of which 3 are 401s, so the ratio is 13.04%.
        # as the time series start with 0 requests, this represents the actual rate computed by Prometheus.
        # Hence we expect a meaningful alert!
        exp_alerts:
          - exp_labels:
              severity: warning
            exp_annotations:
              summary: "There has been a spike of unauthorized requests in the last 2 minutes!"
              description: >
                There has been a spike of unauthorized requests in the last 2 minutes!
                Current value is 13.04%.
              runbook_url: "https://your-oncall-docs.com/what-to-check-in-case-of-401-spikes"
      - eval_time: 3m
        alertname: UnauthorizedRequestsSpike
        # At minute 3, the instant values are 50 requests and 3 unauthorized errors. That said, since our rate function's
        # window is 2m, the actual values considered are 3-0=3 401 errors and a total of
        # 50-10-+3 = 43 requests. As the ratio is below our threshold, no alerts are expected this time.
        exp_alerts:
Check out the entire test case to see what happens when counters reset!
Introducing an alert duration for higher precision
On Prometheus, you can add a duration parameter (for clause) to the alert condition to avoid alerts firing unless the value remains above the threshold defined for some time.
- alert: UnauthorizedRequestsSpike
    # Alert if there's a spike of 401 errors > 10
    # and it lasts for 5 minutes at least
    expr: >
      sum(rate(http_requests_total{service="payments-api", status="401"}[2m])) /
      sum(rate(http_requests_total{service="payments-api"}[2m]))
      > 0.1
    for: 5m
    labels:
      severity: warning
    annotations:
      summary: "There has been a spike of unauthorized requests in the last 5 minutes!"
      description: >
        There has been a spike of unauthorized requests in the last 5 minutes!
        Current value is {{ $value | humanizePercentage }}.
      runbook_url: "https://your-oncall-docs.com/what-to-check-in-case-of-401-spikes"
The above example is almost identical to the previous one, the only difference is that it won’t fire unless the alert condition is true for at least 5 minutes. Duration is sometimes useful to improve alert precision: if you get paged, it's more likely that issues are persistent and require your focus, compared to the previous example which was subject to some level of brittleness:
rule_files:
  - ./alerts.yaml

tests:
  # No errors during the first 2 minutes, then high rates of unauthorized requests for 10 minutes
  - interval: 1m
    input_series:
      - series: 'http_requests_total{service="payments-api", pod="payments-service-abcd", status="200"}'
        # 0 10 20 50 100 150 200 250 300 350 400
        values: 0+10x2 50+50x7
      - series: 'http_requests_total{service="payments-api", pod="payments-service-abcd", status="401"}'
        # 0 0 15 30 45 60 75 90 0 0 0
        values: 0x1 15+15x5 0x2
    alert_rule_test:
      - eval_time: 1m
        alertname: UnauthorizedRequestsSpikeWithDuration
        # At minute 1, there haven't bee 401 errors yet. So we do not expect alerts.
        exp_alerts:
      - eval_time: 5m
        alertname: UnauthorizedRequestsSpikeWithDuration
        # At minute 5, the computed 401 increase over the request total is >20%, but the increase of error
        # only started 3 minutes before, so no alerts are expected
        exp_alerts:
      - eval_time: 7m
        alertname: UnauthorizedRequestsSpikeWithDuration
        # At minute 7, we have the same increase computed as minute 5 but this time the alert is on since 5 minutes,
        # Therefore we actually expect an alert!
        exp_alerts:
          - exp_labels:
              severity: warning
            exp_annotations:
              summary: "There has been a spike of unauthorized requests in the last 5 minutes!"
              description: >
                There has been a spike of unauthorized requests in the last 5 minutes!
                Current value is 23.08%.
              runbook_url: "https://your-oncall-docs.com/what-to-check-in-case-of-401-spikes"
      - eval_time: 8m
        alertname: UnauthorizedRequestsSpikeWithDuration
        # At minute 8, errors are decreasing but we still expect an alert
        exp_alerts:
          - exp_labels:
              severity: warning
            exp_annotations:
              summary: "There has been a spike of unauthorized requests in the last 5 minutes!"
              description: >
                There has been a spike of unauthorized requests in the last 5 minutes!
                Current value is 13.04%.
              runbook_url: "https://your-oncall-docs.com/what-to-check-in-case-of-401-spikes"
      - eval_time: 9m
        alertname: UnauthorizedRequestsSpikeWithDuration
        # At minute 9, the rate of errors over the last 2m window interval is 0, so
        # no alerts are expected
        exp_alerts:
Side effects of using a duration
Beware of the drawbacks of using an alert duration though! Adding a duration might affect your incident response times in a significant way and Google engineers do a great job telling more about that in this chapter of the SRE book.
The purpose of this subchapter is not to suggest one or the other approaches, but instead to show how unit tests could help you focus more on the actual differences and to find out what’s best for your particular use case.
Alert on SLOs with missing scrapes
In this example, we’ll see another standard alert example, where we want to alert if we are not meeting our agreed service level objective (SLO) of 99.9% internal availability for our payments-api, and also see what happens in case no metrics are available!
Our availability definition
Availability here is not defined as mere uptime, but more as request availability: we’re not interested in checking that our service is up and running - or better say, not just that - but that our API actually returns successful responses (almost) all the time. With internal availability we mean the availability of our payments-api and its dependencies, excluding the ones that are external to our infrastructure (Like a bank, for instance).
More formally, we define the internal availability as: $$ \frac{Successful\ requests} {Total\ request - Invalid\ requests - External\ dependency\ errors} $$
In the below samples, we’ll use a custom counter metrics called http_server_sli_total, coming with the usual service label and an additional sli_error_type label that will help us differentiate between:
- Successes → Empty value
- Invalid requests →
invalid_request_error - Internal dependency errors →
internal_dependency_error - External dependency errors →
external_dependency_error
First attempt
Let’s start with a basic sample, assuming for simplicity that we always have metrics available, or - in other words - our service has significant traffic already.
A sample alert rule would be like this:
- alert: LowInternalAvailability
    # Alert if we're not meeting our SLO of 99.9% availability
    expr: >
      sum by(operation) (rate(http_server_sli_total{service="payments-api", sli_error_type=""}[2m])) /
      sum by(operation) (rate(http_server_sli_total{service="payments-api", sli_error_type!~"invalid_request_error|external_dependency_error"}[2m]))
      < 0.999
    for: 2m
    labels:
      severity: critical
    annotations:
      summary: "payments-api has had a low internal availability for the operation {{ $labels.operation}} in the last 3 minutes!"
      description: >
        payments-api has had a low internal availability for the operation {{ $labels.operation}} in the last 3 minutes!
        Current value is {{ $value | humanizePercentage }}.
      runbook_url: "https://your-oncall-docs.com/low-avaiability"
And, its test:
rule_files:
  - ./alerts.yaml

tests:
  - interval: 1m
    input_series:
      - series: 'http_server_sli_total{service="payments-api", pod="payments-service-abcd", operation="CreatePayment", sli_error_type=""}'
        # 50 100 150 200 250 300
        values: 50+50x5
      - series: 'http_server_sli_total{service="payments-api", pod="payments-service-abcd", operation="CreatePayment", sli_error_type="invalid_request_error"}'
        # 0 10 20 30 40 50
        values: 0 10+10x4
      - series: 'http_server_sli_total{service="payments-api", pod="payments-service-abcd", operation="CreatePayment", sli_error_type="internal_dependency_error"}'
        # 0 0 15 30 45 0
        values: 0x1 15+15x2 0
      - series: 'http_server_sli_total{service="payments-api", pod="payments-service-abcd", operation="CreatePayment", sli_error_type="external_dependency_error"}'
        # 0 0 10 10 0 0
        values: 0x1 10x1 0x1
    alert_rule_test:
      - eval_time: 1m
        alertname: LowInternalAvailability
        # At minute 1, only 2 invalid request errors are thrown and our availability scores 100%. No alerts expected
        exp_alerts:
      - eval_time: 2m
        alertname: LowInternalAvailability
        # Things start to change at minute 2, were we observe 10 internal_dependency_error. Our computed availability is 100/(100+15)=86.96%
        # That said it's the first time that we do no meet our SLO, there we do not alert yet!
        exp_alerts:
      - eval_time: 3m
        alertname: LowInternalAvailability
        # Availability is below standard but the 2 minutes duration is not found yet. No alerts
        exp_alerts:
      - eval_time: 4m
        alertname: LowInternalAvailability
        # Alerts are expected here! At minute 4, the computed availability is 100/(100+30)=76.92%
        exp_alerts:
          - exp_labels:
              severity: critical
              operation: CreatePayment
            exp_annotations:
              summary: "payments-api has had a low internal availability for the operation CreatePayment in the last 3 minutes!"
              description: >
                payments-api has had a low internal availability for the operation CreatePayment in the last 3 minutes!
                Current value is 76.92%.
              runbook_url: "https://your-oncall-docs.com/low-avaiability"
Our alert seems to actually do what we want we want, but in our alert rule, we always assume some level of HTTP traffic for our payments-api. It’s a fair and positive assumption, but perhaps something that we can’t take for granted on day 1 of our API. How is our alert above doing in case of low or missing traffic?
Let’s have a look.
Missing scrapes
Let’s see what happens if we see some missing metrics scrape: let’s imagine that our service has low traffic and we just released a new version of our API, which led to counter resets. This scenario is very close to the one that I tried to describe in one of my previous posts.
Our application does not initialize counters to 0 when new services are started, which turns out to be a fairly common thing.
Let’s try to change our test time series to account for missing scrapes and see how our alert behaves. Let’s zoom in on the input_series block for a bit:
# ...
tests:
  - interval: 1m
    input_series:
      - series: 'http_server_sli_total{service="payments-api", pod="payments-service-abcd", operation="CreatePayment", sli_error_type=""}'
        # _ _ _ 1 4 7 10 13 16
        values: _x3 1+3x5
      - series: 'http_server_sli_total{service="payments-api", pod="payments-service-abcd", operation="CreatePayment", sli_error_type="invalid_request_error"}'
        # _ _ _ _ _ 1 1 1 0 0
        values: _x5 1x2 0x1
      - series: 'http_server_sli_total{service="payments-api", pod="payments-service-abcd", operation="CreatePayment", sli_error_type="internal_dependency_error"}'
        # _ _ _ 1 2 0 0 0 0 0
        values: _x3 1+1x1 0x4
      - series: 'http_server_sli_total{service="payments-api", pod="payments-service-abcd", operation="CreatePayment", sli_error_type="external_dependency_error"}'
        # _ _ _ _ _ _ _ _ _ _
        values: _x10
# ...
With the above time series, we’re simulating a scenario where our service starts to get API requests from the third minute. On minute 3 we have a success and an internal error, hence we would expect an exact 50% availability score. At minute 4 we have a total increase of 6 requests, made of 2 successes and 4 internal errors with a computed availability of roughly 66.67%. Finally, at minute 5 our results increased by 6 successes, 1 invalid request (in theory irrelevant to our computation), and 1 internal error (due to how Prometheus does extrapolation). So, we would expect roughly an 85.71% availability at minute 6. Since our availability threshold was lower than the expected one for 2 minutes (remember the for duration clause), we should get an alert now! Let’s complete the test and give it a try:
rule_files:
  - ./alerts.yaml

tests:
  - interval: 1m
    input_series:
      - series: 'http_server_sli_total{service="payments-api", pod="payments-service-abcd", operation="CreatePayment", sli_error_type=""}'
        # _ _ _ 1 4 7 10 13 16
        values: _x3 1+3x5
      - series: 'http_server_sli_total{service="payments-api", pod="payments-service-abcd", operation="CreatePayment", sli_error_type="invalid_request_error"}'
        # _ _ _ _ _ 1 1 1 0 0
        values: _x5 1x2 0x1
      - series: 'http_server_sli_total{service="payments-api", pod="payments-service-abcd", operation="CreatePayment", sli_error_type="internal_dependency_error"}'
        # _ _ _ 1 2 _ _ _ _ _
        values: _x3 1+1x1 _x5
      - series: 'http_server_sli_total{service="payments-api", pod="payments-service-abcd", operation="CreatePayment", sli_error_type="external_dependency_error"}'
        # _ _ _ _ _ _ _ _ _ _
        values: _x10

    alert_rule_test:
      - eval_time: 1m
        alertname: LowInternalAvailability
        exp_alerts:
      - eval_time: 5m
        alertname: LowInternalAvailability
        # Availability is below standard but the 2 minutes duration is not found yet. No alerts
        exp_alerts:
          - exp_labels:
              severity: critical
              operation: CreatePayment
            exp_annotations:
              summary: "payments-api has had a low internal availability for the operation CreatePayment in the last 3 minutes!"
              description: >
                payments-api has had a low internal availability for the operation CreatePayment in the last 3 minutes!
                Current value is 85.71%.
              runbook_url: "https://your-oncall-docs.com/low-avaiability"
      - eval_time: 6m
        alertname: LowInternalAvailability
        exp_alerts:
Surprisingly, the above test fails!
Unit Testing:  06.slo_based_alerts_missing_scrapes/tests.yaml
  FAILED:
    alertname: LowInternalAvailability, time: 5m,
        exp:[
            0:
              Labels:{alertname="LowInternalAvailability", operation="CreatePayment", severity="critical"}
              Annotations:{description="payments-api has had a low internal availability for the operation CreatePayment in the last 2 minutes! Current value is 85.71%.\n", runbook_url="https://your-oncall-docs.com/low-avaiability", summary="payments-api has had a low internal availability for the operation CreatePayment in the last 2 minutes!"}
            ],
        got:[]
But… why?
Let’s leverage an additional test utility offered by Prometheus which gives us the option to actually assert the expected value of our expression at any given time, rather than the presence of an alert. Welcome promql_expr_test, an extra assertion block that we can define besides the alert_rule_test one.
With the help of this new block, we can translate our expectations above into actual promtool assertions:
rule_files:
  - ./alerts.yaml

tests:
  - interval:
    # ... unchanged ...
    promql_expr_test:
      # At minute 3 we expect 50% availability
      - expr: >
          sum by(operation) (rate(http_server_sli_total{service="payments-api", sli_error_type=""}[2m])) /
          sum by(operation) (rate(http_server_sli_total{service="payments-api", sli_error_type!~"invalid_request_error|external_dependency_error"}[2m]))
        eval_time: 3m
        exp_samples:
          - value: 0.5
      # At minute 4 we expect roughly 66.67% availability. The increase of
      # successes over the last 2 minutes is computed with the help of some
      # extrapolation mechanism: Prometheus applies the same rate experienced in
      # the last minute, cutting off at 0. So the number of successful requests
      # that Prometheus computes for minute 2 is 0 (instead of -2)
      - expr: >
          sum by(operation) (rate(http_server_sli_total{service="payments-api", sli_error_type=""}[2m])) /
          sum by(operation) (rate(http_server_sli_total{service="payments-api", sli_error_type!~"invalid_request_error|external_dependency_error"}[2m]))
        eval_time: 4m
        exp_samples:
          - value: 0.6666666666666666
            labels: '{operation="CreatePayment"}'
      # At minute 5 we expect roughly 75% availability
      - expr: >
          sum by(operation) (rate(http_server_sli_total{service="payments-api", sli_error_type=""}[2m])) /
          sum by(operation) (rate(http_server_sli_total{service="payments-api", sli_error_type!~"invalid_request_error|external_dependency_error"}[2m]))
        eval_time: 5m
        exp_samples:
          - value: 0.75
            labels: '{operation="CreatePayment"}'
      # At minute 6 we expect roughly 100% availability
      - expr: >
          sum by(operation) (rate(http_server_sli_total{service="payments-api", sli_error_type=""}[2m])) /
          sum by(operation) (rate(http_server_sli_total{service="payments-api", sli_error_type!~"invalid_request_error|external_dependency_error"}[2m]))
        eval_time: 6m
        exp_samples:
          - value: 1
            labels: '{operation="CreatePayment"}'

    alert_rule_test:
      # ... unchanged ...
      - eval_time: 1m
By running again our test we should now get a new - more explicit - error:
expr: "sum by(operation) (rate(http_server_sli_total{service=\"payments-api\", sli_error_type=\"\"}[2m])) / sum by(operation) (rate(http_server_sli_total{service=\"payments-api\", sli_error_type!~\"invalid_request_error|external_dependency_error\"}[2m]))\n",
  time: 3m,
  exp: {} 5E-01
  got: nil
This is basically saying that our expectations for what should have happened at minute 3 are wrong: we expected the computed rate to be 50% but it turns out that Prometheus can’t compute any value!
The error we made was to assume that a missing scrape would be considered as a 0 by Prometheus, but that is not the case: a missing scrape is more simply an undefined value. As the rate function requires at least 2 data points to compute a value, it can’t actually find one in this case. So, the correct assertion for minute 3 is as follows:
- expr: >
      sum by(operation) (rate(http_server_sli_total{service="payments-api", sli_error_type=""}[2m])) /
      sum by(operation) (rate(http_server_sli_total{service="payments-api", sli_error_type!~"invalid_request_error|external_dependency_error"}[2m]))
    eval_time: 3m
    exp_samples:
    # we do not expect any value here!
Finally, due to the missing increase of errors at minute 3, our alert condition only stays true for 1 minute. Therefore there won’t be any alert firing, because the alert duration that we declared with the help of the for clause is 2 minutes! To get the test passing, we should then modify our alert_rule_test assertions to never expect an alert!
alert_rule_test:
  - eval_time: 1m
    alertname: LowInternalAvailability
    exp_alerts:
    # No errors nor requests at this stage. No alerts expected
  - eval_time: 5m
    alertname: LowInternalAvailability
    # Availability is below standard but the 2 minutes duration
    # threshold is not reached yet. No alerts expected
    exp_alerts:
  - eval_time: 6m
    alertname: LowInternalAvailability
    exp_alerts:
    # In order for a metric to disappear from Prometheus we need
    # at least 5 missing scrapes. Therefore the same value as minute 5
    # is considered for internal errors, hence no increase is found.
    # At the same time successful requests are growing so the availability
    # goes back to 100%. No alerts are expected!
At this point, I hope that you’re convinced a bit more of how unit testing rules can shed light the on internal of Prometheus and help you set exact expectations for your production systems!
The entire alert and test example related to this last scenario can be found here.
Different policies depending on the time of the day
Let’s now see one last example where unit tests can come into help: setting different alerting policies based on the time of the day. This is particularly useful when you want to treat minor issues very noisily during working hours but to turn a blind eye to the same when happening at night, to not bother your on-callers for low-impact glitches.
Alert definition
I’ve been using this setup recently to alert on AMQP dead-lettered messages:
rules:
  - alert: DeadLetteredMessagesInHours
    annotations:
      summary: "{{ $labels.queue }} has {{ $value }} dead-lettered messages"
      description: |
        There are {{ $value }} dead-lettered messages on the `{{ $labels.queue }}` queue in the `{{ $labels.vhost }}` virtual host.
      runbook_url: "https://your-oncall-docs.com/dead-lettered-messages"
    # During in-hours shifts (Monday to Friday from 10AM UTC to 4:59PM UTC) we want a noisy
    # policy for alerts: even one single message in DLQ for at least 2 minutes should page us
    # Note that:
    # - the amqp_message_ready metric is a counter that represents the messages which are sitting
    #   on a queue ready to be consumed
    # - we're using the max operator to aggregate metrics coming from multiple service instances/pods
    expr: |
      max(amqp_messages_ready{vhost="payments", queue="notifications.deadletter"}) by (queue, vhost) > 0
      and on() ((hour() >= 10 < 17) and (day_of_week() >= 1 < 6))
    for: 2m
    labels:
      severity: critical

  - alert: DeadLetteredMessagesOffHours
    annotations:
      summary: "{{ $labels.queue }} has {{ $value }} dead-lettered messages"
      description: |
        There are {{ $value }} dead-lettered messages on the `{{ $labels.queue }}` queue in the `{{ $labels.vhost }}` virtual host.
      runbook_url: "https://your-oncall-docs.com/dead-lettered-messages"
    # During off-hours shifts (Monday to Friday before 10AM and from 5PM, and at every
    # hour during the weekend) we want a more relaxed policy: we should only page the on-caller
    # if the number of dead-lettered messages is greater than 3.
    expr: |
      max(amqp_messages_ready{vhost="payments", queue="notifications.deadletter"}) by (queue, vhost) > 3
      and on() (((hour() >= 17 or hour() < 10) and (day_of_week() >= 1 < 6)) or (day_of_week() == 0 or day_of_week() >= 6))
    for: 2m
    labels:
      severity: critical
In the above alert, I have defined a noisy alert policy for dead-lettered messages during the in-hours shift (Monday to Friday from 10 AM to 5 PM) and a more relaxed one for the off-hours shift (Monday to Friday before 10 AM and after 5 PM, at every hour during the weekend): the condition for paging someone is at least 1 message during the in-hours shift, and at least 4 of them at night or during the weekend.
Test the different in and off-hours policies
Let’s now define a test to verify our expectations during the off-hours shift first: we don’t want to spoil our sleep!
tests:
  # Off-hours test
  - interval: 1m
    input_series:
      # We simulate to different series of metrics produced by different pods
      - series: 'amqp_messages_ready{vhost="payments", queue="notifications.deadletter", pod="abcd"}'
        values: '10x3'
      - series: 'amqp_messages_ready{vhost="payments", queue="notifications.deadletter", pod="efgh"}'
        values: '0x3'
    alert_rule_test:
      - eval_time: 1m
        alertname: DeadLetteredMessagesOffHours
        exp_alerts:
        # No errors are expected at this stage. The alert condition changed to true just now
      - eval_time: 2m
        alertname: DeadLetteredMessagesOffHours
        exp_alerts:
        # The alert condition has been true on 2 consecutive minutes,
        # so an alert is now expected!
          - exp_labels:
              severity: critical
              queue: notifications.deadletter
              vhost: payments
            exp_annotations:
              summary: "notifications.deadletter has 10 dead-lettered messages"
              description: >
                There are 10 dead-lettered messages on the `notifications.deadletter` queue in the `payments` virtual host.
              runbook_url: "https://your-oncall-docs.com/dead-lettered-messages"
      - eval_time: 2m
        alertname: DeadLetteredMessagesInHours
        exp_alerts:
        # we do not expect alerts from the in-hours policy as the defined shift starts at 10AM UTC
It’s important to note how the eval_time definition is relative to midnight UTC and to the current day.
Finally, let’s also check that even a single dead-lettered message is enough to alert us at work:
tests:
  # In-hours test
  - interval: 1m
    input_series:
      # We simulate to different series of metrics produced by different pods
      - series: 'amqp_messages_ready{vhost="payments", queue="notifications.deadletter", pod="abcd"}'
        # 10 hours is 600 minutes...
        values: '1x600 1x1'
      - series: 'amqp_messages_ready{vhost="payments", queue="notifications.deadletter", pod="efgh"}'
        values: '0x600 0x1'
    alert_rule_test:
      - eval_time: 10h
        alertname: DeadLetteredMessagesInHours
        exp_alerts:
        # No errors are expected at this stage. The alert condition changed to true just now (because of the hour change)
      - eval_time: 10h1m
        alertname: DeadLetteredMessagesInHours
        exp_alerts:
        # Same as the above one, our alert condition has not been true for 2 minutes (yet)
      - eval_time: 10h2m
        alertname: DeadLetteredMessagesInHours
        exp_alerts:
        # The alert condition has been true on 2 consecutive minutes,
        # so an alert is now expected!
          - exp_labels:
              severity: critical
              queue: notifications.deadletter
              vhost: payments
            exp_annotations:
              summary: "notifications.deadletter has 1 dead-lettered messages"
              description: >
                There are 1 dead-lettered messages on the `notifications.deadletter` queue in the `payments` virtual host.
              runbook_url: "https://your-oncall-docs.com/dead-lettered-messages"
      - eval_time: 10h2m
        alertname: DeadLetteredMessagesOffHours
        exp_alerts:
        # we do not expect alerts from the off-hours policy as the defined shift starts at 10AM UTC
Isn’t this a cool way of raising confidence in your alerts, even at night? You can focus on preparing your dinner instead of making sure you won't be woken up by a negligible glitch tonight.
Key takeaways and unsolved problems
By now, I hope you are really looking forward to adding unit tests to your Prometheus alerts!
In my experience, they have been really helpful in improving the operational readiness of my team: they did not just help set correct alerting rules but also, and I’d say almost equally importantly, they encouraged my team to always decorate each and every alert with all the meaningful context, from clear summaries and descriptions to links to our on-call playbooks.
Last but not least these tests have been probably my favorite way to understand a bit more about how Prometheus works, especially when it comes to the rate functions and its extrapolation magic as well as counter resets!
That being said, it’s important to note that this type of test is partial: the tests shown in this article mostly focus on making sure your Prometheus rules are working as you would expect.
They do not necessarily help you write simpler and/or more performant queries, and with this kind of test, you can’t actually check that the metrics you are asserting actually exist on your Prometheus database! From a unit test perspective, you can have a state-of-the-art alert, but if you type http_request_total (singular) instead of http_requests_total (plural) you might get a very unpleasant and unexpected call from one of your customers.
This category of problems requires different testing strategies and tools. One example is pint, developed by the Cloudflare engineering team. I may write about it in a future post here!
Additional resources
Here you can find all the alerts and tests shown in this article.
Moreover, a list of of resources I've either directly referenced here or used to prepare this post: