on
Fooled by Prometheus rate function
A couple of weeks ago I had to deal with an incident that affected one of the services that my team owns at my job.
It was a minor issue that manifested with a bunch of internal dependency errors thrown by our gRPC internal endpoints. The origin of those errors was a regression introduced by one of our service dependencies, promptly solved by reverting a couple of PRs.
What really got me thinking and inspired further actions (including this blog post), was our availability board on Grafana:
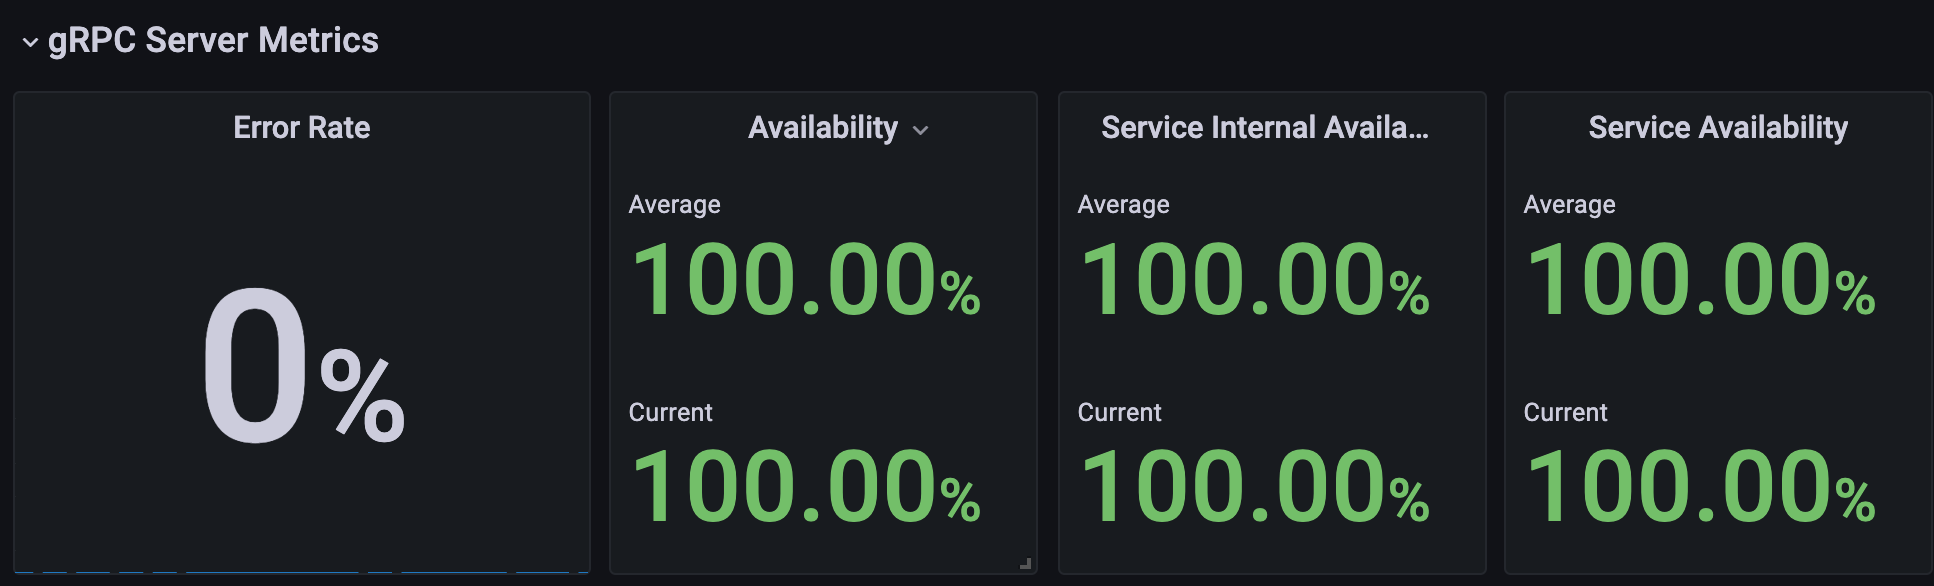
Unexpectedly, our Service level indicators (SLI), inspired to the ones defined by Google SREs, showed all good during the incident time window.
At first I thought of a blip on our Prometheus queries. Our service is relatively new and these kind of issues it's not so uncommon. Further investigations though showed different results.
Let's put our error rates under the microscope.
Error rates explained
This is how an error rate more or less looks like:
sum(rate(grpc_server_sli_total{service="foo", sli_error_type!=""}[1m]))
The main concepts to grasp here are:
- the metric identifier,
grpc_server_sli_totalin this case. As the name suggests, it refers to gRPC requests handled by our service. What's included in graph brackets are additional filters to narrow our focus on what really interests us. In this particular case we want to get non successful gRPC requests handled by our service named foo; - The
ratefunction is used to compute the increase of errors, rather than ever-growing counters, along with its time interval selection of 1 minute. More on the next chapter; - We aggregate samples produced by different instances of our service foo with the help of the
sumfunction. If you're familiar with Kubernetes, this will help you merging results produced by different pods belonging to the same deployment.
Prometheus rate function
From Prometheus docs, the rate function
calculates the per-second average rate of increase of the time series in the range vector.

Okay. what’s a range vector, then ?
a set of time series containing a range of data points over time for each time series.
Unlike instant vectors, range vectors are represented with a list of results, belonging to a specific time interval. We get a range vector with the help of selectors made of the metric identifier + the interval in which we want to look for:
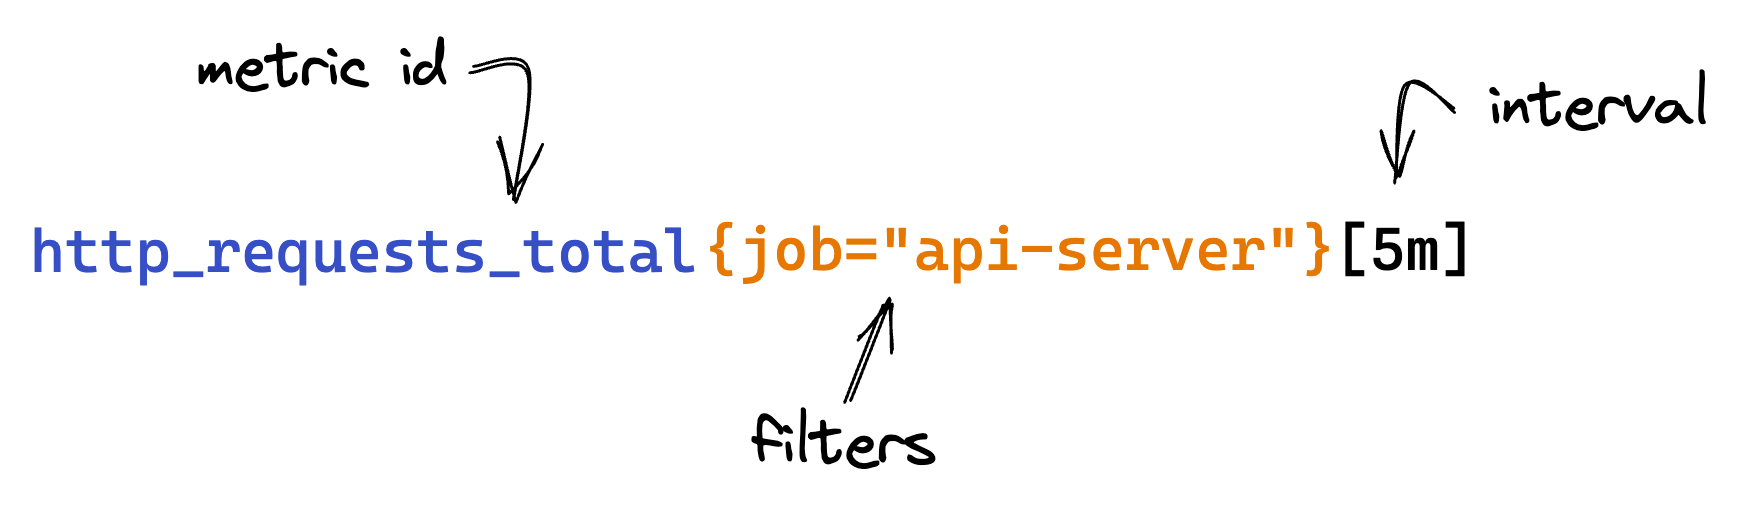
When I first stumbled across the time interval, I got a bit confused by that. What’s the best value to use ? How does that cope with the time interval usually selected on tools like in Grafana ?

After a bit of research, I found out that the accepted best practice seems to be at least 4X times the scrape interval, to be resilient with failed scrapes.
If you use Grafana, as of version 7.2, there's dynamic $__rate_interval variable that should help with that.
A very important detail
A very key bit to remember about the rate function is that it works properly with at least 2 samples of your metric: the increase from null to something is 0! This means that the rate function doesn't play well with counters that are not initialized to 0.
The problem with uninitialized counters
This is exactly the reason why our boards shown at the beginning of this blog post were so green. We don't initialize error counters to 0 at service startup time, but we increment those counters to 1 (and more) as failed requests happen. Below is how one of our produced error metric looks like:
...
grpc_server_sli_total{service="foo", grpc_method="CreateVRPMandate", sli_error_type="internal_dependency_error", sli_dependency_name="ob_connector"}
...
This is potentially a problem in 2 scenarios, mostly:
- New services shipped to production, still with low traffic
- Whenever a new version of a service is released
Services with low traffic are mostly impacted by this because more time is required to initialize error counters. Those are also circumstances where even a very low amount of error is non negligible at all.
The second scenario is probably more interesting for a broader set of service. To be precise, it does manifest not just during planned new releases rollouts but also during regular service instances rotation. This is a typical scenario in a Kubernetes cluster: whenever k8s decides to shutdown one of your pod because it's consuming too much resources for instance, you might encounter error counters blips.
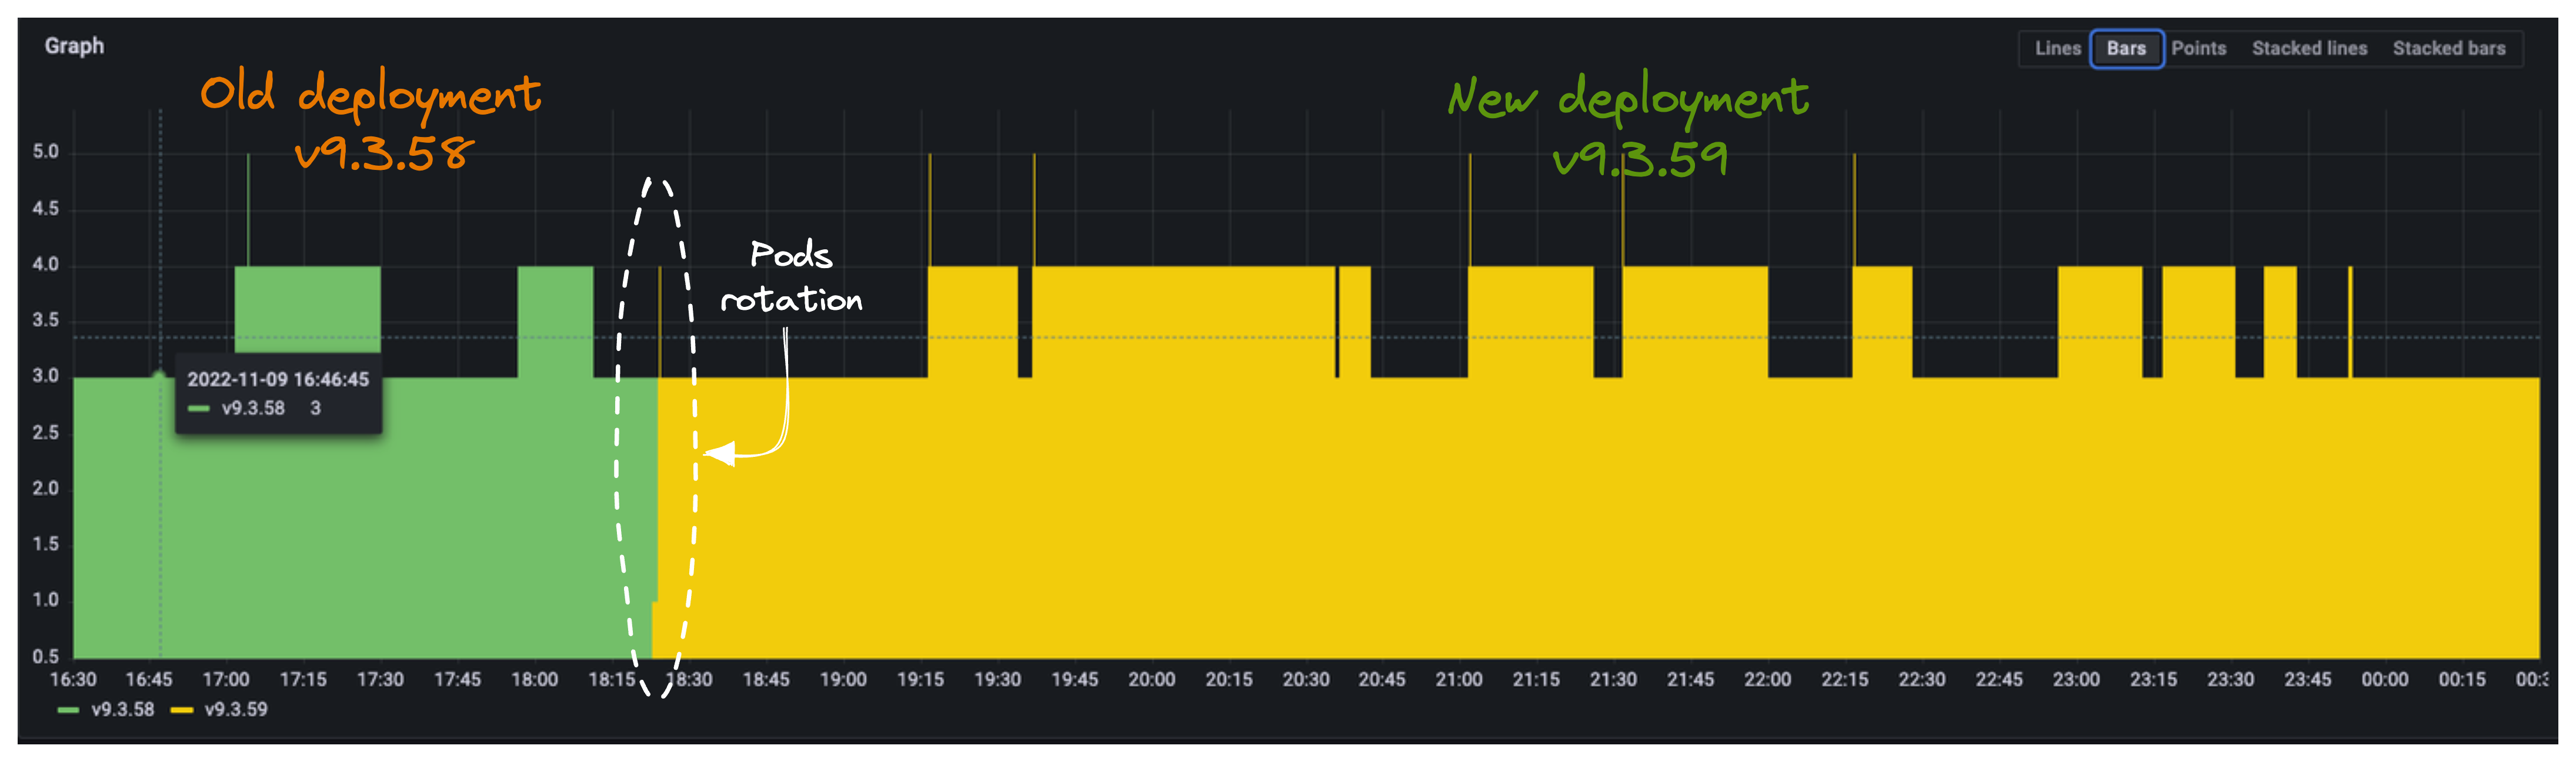
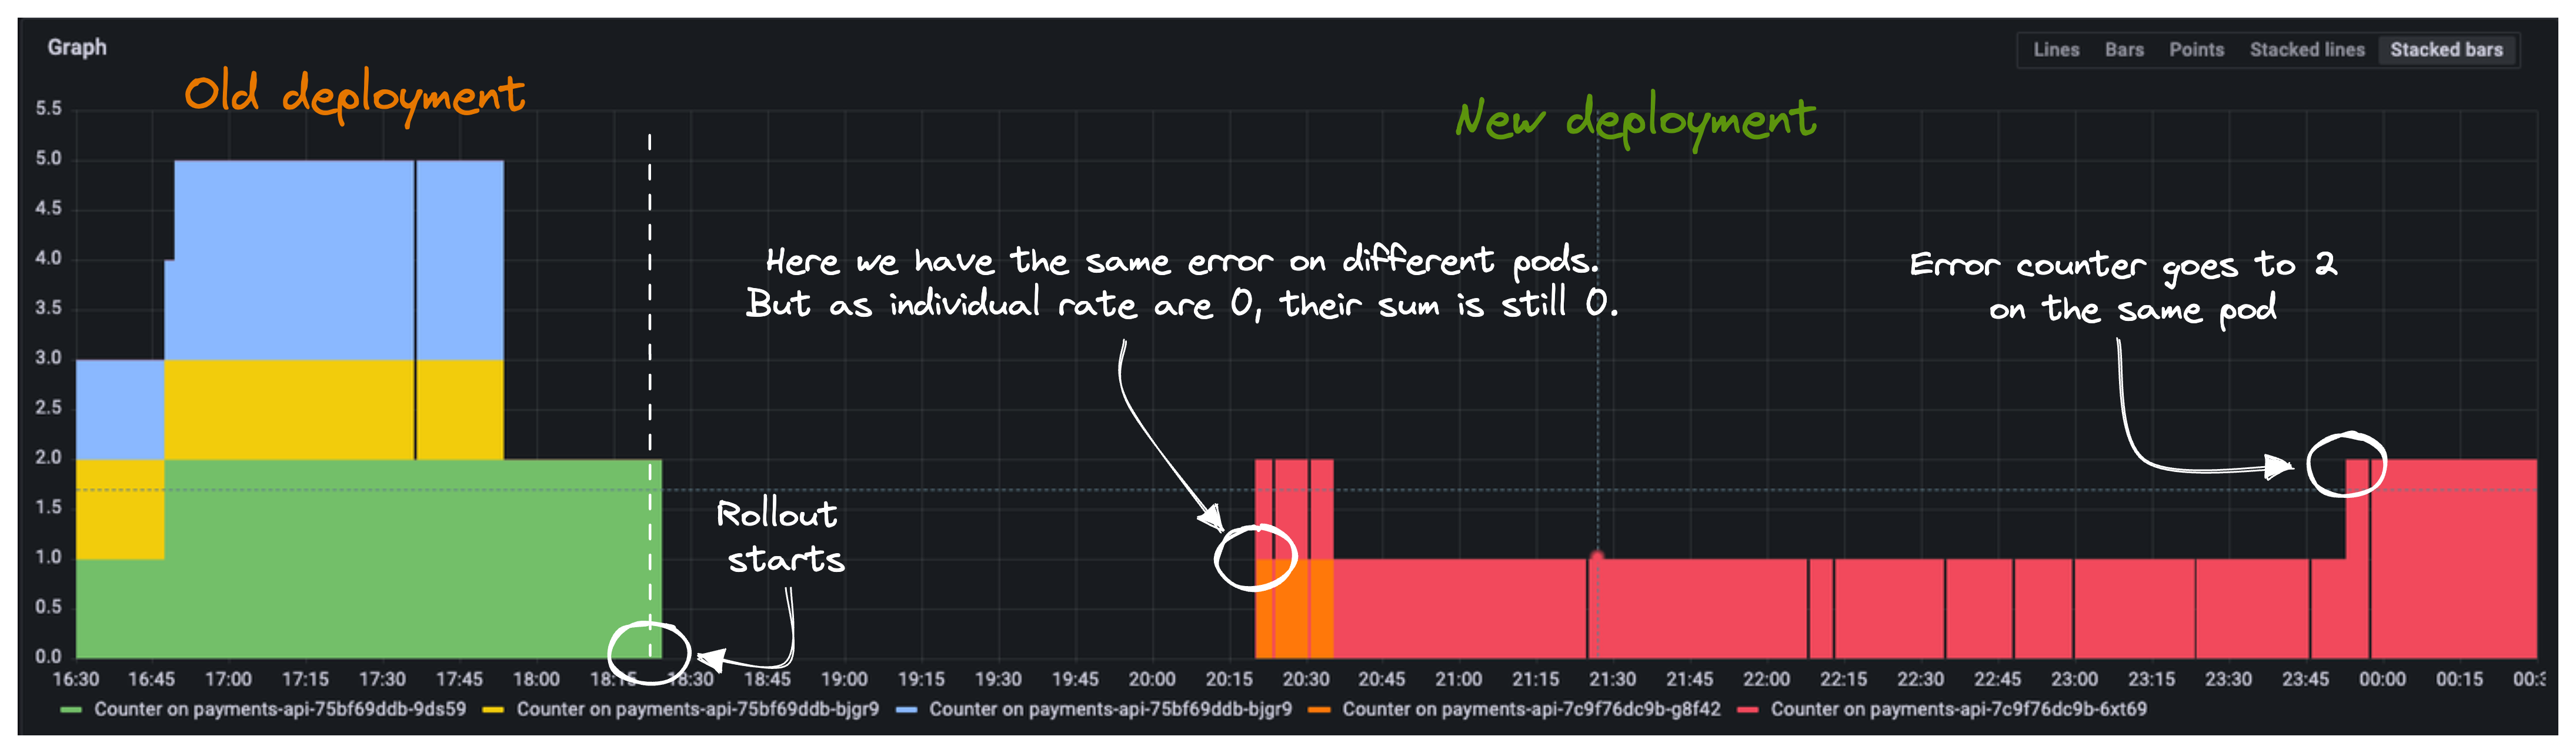
Below a few screenshots showing the impact of a new service release (v9.3.59) on error counters of type internal_dependency_error.
At ~18:20 we can see new release kicking in:
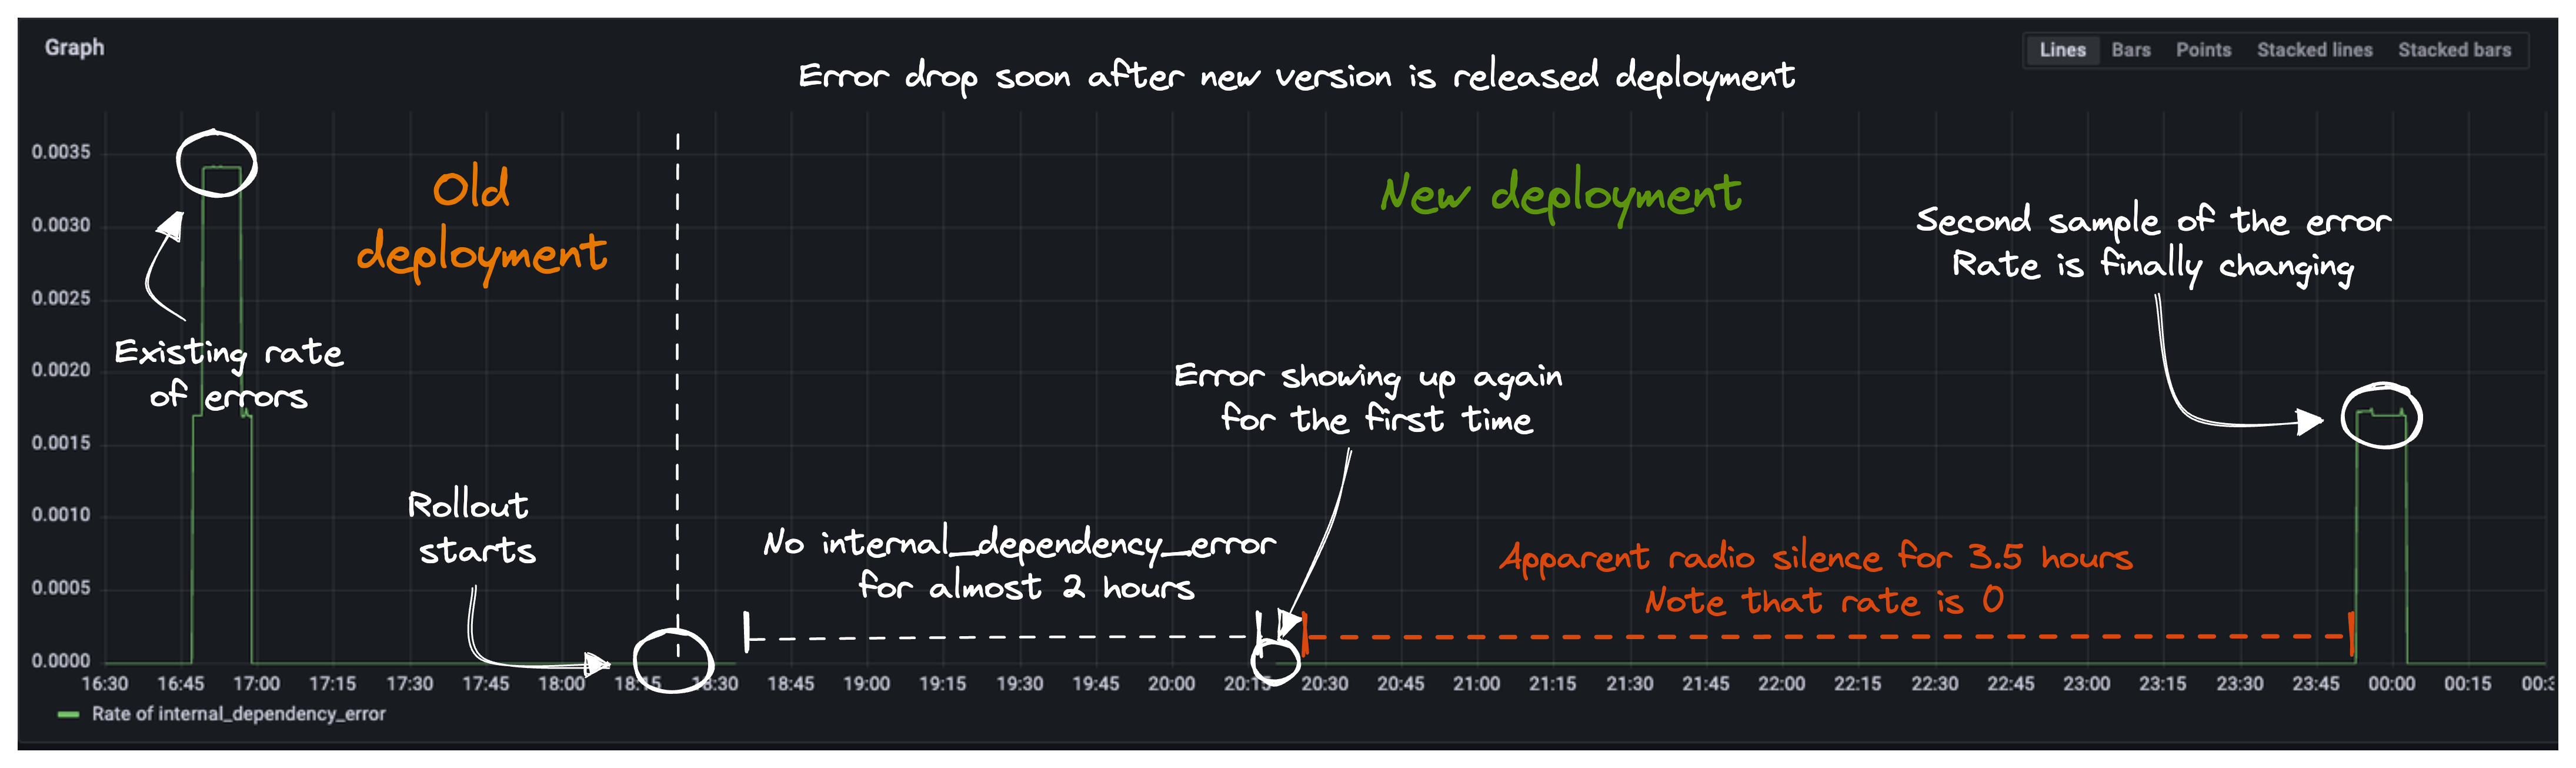
Below screenshot shows how that impacted the rate of errors value (the thin green line). We can see how that
changes right before and after the release moment. Moreover, we can see how we had to wait 3.5 hours to see the first internal_dependency_error impacting again our computed error rate.
Finally, a view on error counters in isolation. We can see how each counter got reset as soon as the new pods replaced the old ones belonging to deployment v9.3.58.
At ~20:15 is also clear how the sum function is not really of great help in case of counters updated on different pods. Whilst we got 2 appearances of error at that time, since they happened on different pods, each pod individual rate is 0 and so their sum is also 0.
Potential solutions and key takeaways
The correctness of the rate function is a quite largely debated topic by the online community. In the context of my investigation I also stumbled across this 5 years old open proposal on the Prometheus repository that, if implemented, would actually solve all the headaches.
The most reliable and suggested advice I've found is to initialize your counters to 0. As simple as that!
That said, this might not be the easiest thing to do in your service. Often times gRPC/HTTP requests counters are updated with the help of stateless middlewares, as soon as those requests are handled by your service. Whilst this is very nice from the perspective of separation of concerns and helps not poisoning your business domain logic with monitoring related tasks, at the same time it makes initialization tasks like the one mentioned above a bit harder to implement.
Depending on the specific scenario, you might think of trading a bit of readability and maintainability of your solution with an improved correctness of your metrics.
Last but not least, it's also worth considering what's the ultimate use of your metrics: if you don't plan to wake somebody up at night for a couple of requests spoiling the rightmost decimals of your SLI indicators, then to lose a bunch data points is probably totally fine.